NBAA Leadership L3/L4 PDP - BACE - Oct 18-19 2026

  • Home
  • About
    • Profile
    • Team
    • Partners
  • Services
    • Aviation Leadership
    • Assessments
    • Cabin Safety
    • Consulting
  • Online
    • Client Online
    • Student Online
  • Resources
    • Support
    • Portfolio
    • Presentations
    • Podcasts
    • Cabin Crew Surveys
  • Contact
  • More
    • Home
    • About
      • Profile
      • Team
      • Partners
    • Services
      • Aviation Leadership
      • Assessments
      • Cabin Safety
      • Consulting
    • Online
      • Client Online
      • Student Online
    • Resources
      • Support
      • Portfolio
      • Presentations
      • Podcasts
      • Cabin Crew Surveys
    • Contact
  • Home
  • About
    • Profile
    • Team
    • Partners
  • Services
    • Aviation Leadership
    • Assessments
    • Cabin Safety
    • Consulting
  • Online
    • Client Online
    • Student Online
  • Resources
    • Support
    • Portfolio
    • Presentations
    • Podcasts
    • Cabin Crew Surveys
  • Contact

The 2026 USA Salary Benchmark Report provides an in-depth analysis of compensation for full-time Corporate Cabin Crew and Lead Cabin Crew/Managers across business aviation. Developed from industry survey responses, this report offers valuable insight into current salary trends, benchmark compensation, experience levels, operational sectors, and demographic data shaping today's market.


As business aviation continues to evolve, understanding competitive compensation has become increasingly important for both aviation professionals and employers. Whether negotiating a new position, evaluating internal pay structures, planning career progression, or developing hiring strategies, reliable salary benchmarking provides an essential foundation for informed decision-making.


The findings in this report identify emerging salary benchmarks while highlighting the factors that most influence compensation, including years of experience, type of operation, leadership responsibilities, and organizational structure. By presenting real-world data from professionals working throughout the United States, this report serves as a practical resource for individuals, flight departments, hiring managers, and industry leaders seeking a clearer understanding of today's compensation landscape.

Go to 2026 Global Daily Rate Reports

Global Full-Time Salary Participants

Page Directory

USA Full-Time Cabin Crew Benchmark ReportUSA Lead/Manager Benchmark ReportSalary Negotiations Global Full-Time Benchmark ReportGlobal Lead/Manager Benchmark Report

View online or downlaod the PDF handouts

USA - Benchmark Salaries Report 2026 (pdf)

Download

Global - Benchmark Salaries Report 2026 (pdf)

Download

USA Full-Time Benchmark Report

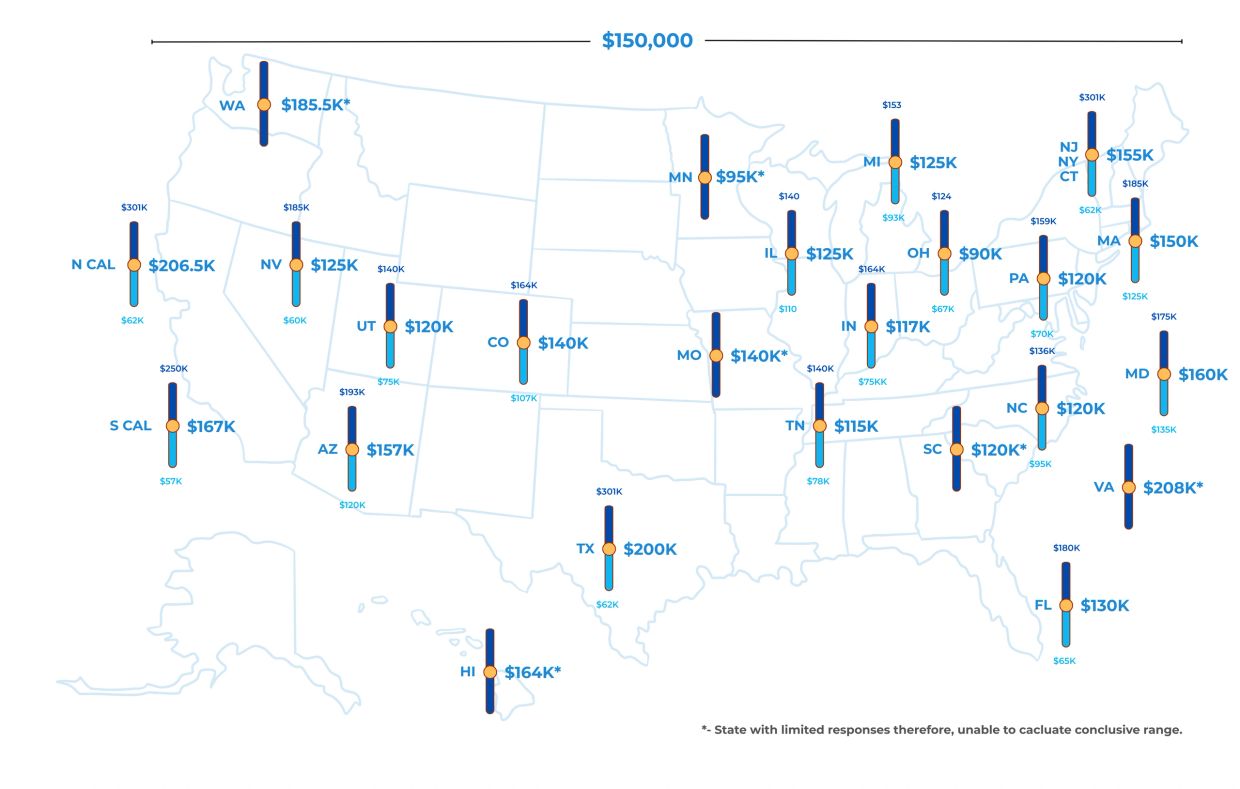
USA Benchmark Report

After reviewing the full-time salary data, the market has begun to consolidate around a clear benchmark. The median of approximately $152,000 and average of approximately $151,000 indicate that $150,000 USD has emerged as the current benchmark annual salary for experienced full-time corporate cabin crew in the United States.


Benchmark Salary > $150,000 USD/year

Average Salary > $151,000/year

Median Salary > $152,000/year

Lowest Reported > $55,000

Highest Reported> $301,000


REFERENCE: Sājet Solutions first published the USA benchmark salary in 2019 = $67,000 (national low/high range: $37,500-$220,00).


Key Observations

  • Part 91 corporate flight departments continue to report the highest compensation overall, with an average salary of approximately $173,000. The highest reported salary in the survey ($301,000) was earned by a respondent working in a Part 91 operation, reinforcing the premium compensation typically associated with private corporate flight departments.
  • Part 91K (fractional) operators salaries ranged from $57,000 to $105,000, reflecting the more standardized compensation structures commonly found with fractional ownership programs. Among the major operational categories represented in the survey, Part 91K (fractional) operators reported the lowest salary range.
  • Part 135 charter operations demonstrated considerable variability in compensation, with salaries ranging from $65,000 to $235,000 and an average salary of approximately $125,000. This wide range highlights the diversity of operators, aircraft types, and position responsibilities within the charter sector.
  • Hybrid Part 91/135 operations reported salaries ranging from $55,000 to $235,000, with a median salary of $135,000. Compensation in these mixed-certificate flight departments generally falls between dedicated Part 91 corporate operations and traditional Part 135 charter operators, although several respondents reported salaries exceeding $200,000.
  • Part 125 operations were represented by a limited number of responses. There was insufficient data to establish a meaningful benchmark or representative salary range for this operational category.


These figures align with the trend seen throughout the survey:

  • Private Part 91 flight departments generally offer the highest compensation.
  • Charter (135) compensation varies substantially depending on aircraft type, company size, and role.
  • Fractional (91K) salaries tend to be more standardized and lower than private corporate departments.


Comparision - 2024 Benchmark Salaries by Type of Operation:

Part 91 - $82,000-$220,000

Part 91K - $48,500-$95,000

Part 135 - $37,500-$112,500


Years of Experience vs Salary Range

1 year or less > $55,000–$80,000 (average salary: $70,000)

1-2 years  > $62,000–$175,000 (average salary: $88,900)

3-5 years > $60,000–$220,000 (average salary: $119,906)

6-9 years > $57,000–$215,000 (average salary: $152,491)

10-15 years > $67,000–$301,000 (average salary: $158,733)

16-20 years > $85,000–$225,000 (average salary: $164,927)

21-25 years > $95,200–$235,000 (average salary: $174,600)

26+ years > $78,000–$230,000 (average salary: $145,000)


Key Findings: Years of Experience vs Salary

  • Compensation generally increases with experience, with the most significant salary growth occurring after five years in business aviation.
  • Cabin crew with 6-9 years of experience have, on average, reached the 2026 benchmark salary of approximately $150,000, demonstrating that significant earning potential can be achieved relatively early in a business aviation career.
  • The highest average salary was reported by professionals with 21-25 years of experience, averaging $174,600annually.
  • The highest individual salary reported in the survey ($301,000) came from a respondent with 10-15 years of experience, illustrating that factors such as the type of operation, employer, aircraft, and responsibilities can have a greater influence on compensation than tenure alone.
  • While salaries generally trend upward with experience, the 26+ years category reported a slightly lower average salary than the 21-25 years group, suggesting that compensation is influenced by multiple factors beyond years of service, including the diversity of roles and employers represented within the survey.

USA Full-Time - Type of Operation

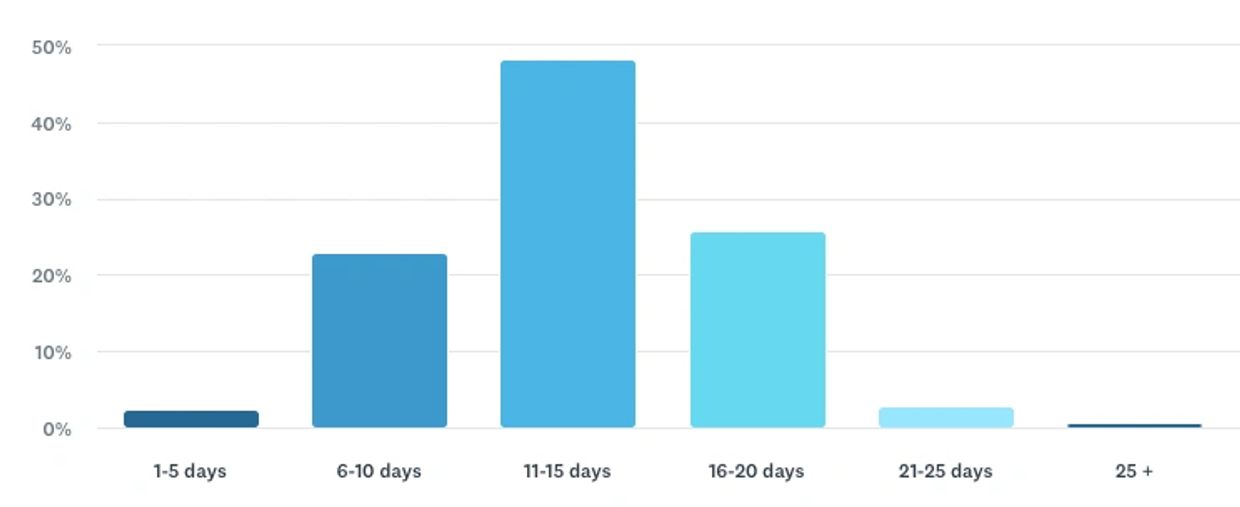
USA Full-Time Days Flown Per Month (Average)
USA Full-Time Schedules/Rotations

Scheduling Practices

The survey highlights the wide variety of scheduling models used across corporate flight departments - there is no standard roster system in business aviation. 


Schedules are largely influenced by the needs of the principal, aircraft utilization, department size, and company culture. Respondents reported everything from fully on-demand operations to structured rotations with predictable time off.

Scheduling Models Reports

ON-DEMAND/ON-CALL OPERATIONS (Most Common)

The most frequently reported scheduling model was on-demand, with cabin crew available as trips arise rather than working from a fixed roster.


Common characteristics included:

  • On-demand scheduling
  • On-call 24/7/365
  • No published schedule
  • As needed
  • Schedule changes frequently
  • Trips assigned based on operational demand
  • Vacation or PTO required for guaranteed time off


Many respondents also indicated they receive a minimum number of "hard days off" each month despite remaining primarily on-demand.


37.6% > On-Demand / On-Call / No Fixed Schedule

28.8% > Rotation Schedule

08.8% > Monthly Published Schedule

06.4% > Flexible / Team-Managed / Shared Schedule

18.4% > Other / Mixed / Insufficent Detail


MONTHLY SCHEDULING

A significant number of respondents receive a monthly published schedule, often created by a lead cabin attendant or department manager.


Comments included:

  • Monthly schedule issued in advance
  • Schedule available by the 15th of the previous month
  • Flying schedule known weeks or months ahead
  • Scheduled flights with advance notice


These departments generally reported greater schedule predictability than fully on-demand operations.


FLEXIBLE TEAM SCHEDULING

Several flight departments described collaborative scheduling practices where cabin crew coordinate coverage among themselves.


Examples included:

  • Trips divided equally among cabin attendants
  • Shared scheduling between two cabin crew
  • Float positions supporting multiple aircraft
  • Dedicated aircraft assignments with float coverage
  • Contractors utilized to cover time off


These models provide greater operational flexibility while helping balance workload across the team.

Rotation Schedules

Many corporate departments have adopted structured rotations that provide predictable work-life balance.


19% > 15 days on / 13 days off

19% > 07 days on / 07 days off

17% > 08 days on / days 06 off

11% > 02 weeks on / 02 weeks off

06% > 16 days on / 16 days off

03% > 20 days on / 10 days off

03% > 21 days on / 07 days off

03% > 17 days on / 14 days off

03% > 11 days on / 09 days off

17% > other unique rotations

Time Off

Most departments reported structured time-off benefits, including:

  • Hard days off each month (typically 5–10 days)
  • Approximately 10–15 days off per month
  • Four weeks annual vacation
  • Unlimited PTO (reported by one respondent)
  • Additional overtime pay after exceeding scheduled workdays
  • Contractor support to preserve scheduled days off

Key Takeaways

38% of full-time cabin crew continue to work primarily on-demand or on-call schedules.


Nearly 29% now work under a structured rotation, highlighting the industry's shift toward more predictable schedules.


The most common rotations are:

  1. 15 days on / 13 days off
  2. 7 days on / 7 days off
  3. 8 days on / 6 days off


About 9% of respondents receive a monthly published schedule, providing greater advance notice and predictability.


A smaller but notable 6% reported collaborative or team-managed scheduling, where crew members coordinate coverage and time off.

USA Full-Time Annual Raises, COLA & Bonuses

The survey indicates that while base salary remains an important measure of compensation, many employers also provide annual salary increases, cost-of-living adjustments (COLA), performance-based raises, bonuses, overtime incentives, and additional financial benefits.

Overall Breakdown

68% > Annual Raise / Cost of Living Increase

Most common benefit reported


58% > Annual Bonus

Performance or discretionary bonuses frequently reported


45% > Both Raise & Bonus

Nearly half receive both annually


22% > No Annual Increase or Bonus

Respondents reported no formal compensation increases


10% > Unsure / New Employee / N/A

Too new to determine benefits

Annual Salary Increases

The majority of respondents reported receiving annual salary adjustments, most commonly between:

  • 2-3% annual increases (most common)
  • 3-5% annual increases
  • 4-6% performance increases
  • 8-10% raises (reported by a small number of respondents)


Several respondents also noted:

  • Merit-based raises tied to annual reviews
  • Scheduled longevity increases
  • Salary adjustments of 10-15% after several years of employment
  • Fixed annual salary increases (e.g., $5,000-$15,000)


MOST COMMON RAISE PERCENTAGES

03% increase > Most frequently reported

02% increase > Common

04-06% increase > Fairly common

08-10% increase > Limited number of premium employers

Annual Bonuses

Bonus structures varied considerably across operators.


Reported bonus types included:

  • Annual performance bonus
  • Company performance bonus
  • Holiday/Christmas bonus
  • Profit sharing
  • Owner discretionary bonus
  • Longevity bonus
  • Stock options
  • Holiday pay incentives


Common Bonus Amounts:

  • 5-10% of salary
  • 10% annual bonus
  • 14% annual bonus
  • 15-20% annual bonus
  • $1,000-$5,000
  • $10,000
  • $20,000
  • $25,000
  • One respondent reported a $40,000 annual bonus.


Several respondents also reported bonuses tied to:

  • Flight hours
  • Overtime
  • Extended duty days
  • Holiday flying
  • Flight Duty Pay (FDP)
  • Pension contributions
  • Enhanced 401(k) matching
  • Stock options

Additional Compensations

Many respondents indicated they receive supplemental compensation beyond salary and bonuses, including:

  • Overtime pay
  • Flight Duty Pay (FDP)
  • Extended day pay
  • Holiday premium pay
  • Retainer pay
  • Pension plans
  • Enhanced 401(k) matching
  • Stock options
  • Longevity bonuses
  • Additional compensation in lieu of vacation

Key Findings

Approximately two-thirds of respondents reported receiving an annual salary increase or cost-of-living adjustment, with 3% emerging as the most common annual increase.


Nearly 60% indicated they receive some form of annual bonus, although the structure and amount varied widely.


Almost half of respondents benefit from both annual raises and bonuses, demonstrating that total compensation often extends beyond base salary.

Premium flight departments frequently supplement salary with performance incentives, overtime, Flight Duty Pay, retirement contributions, and other financial benefits, significantly enhancing overall compensation.


Conversely, approximately one in five respondents reported receiving no annual raises or bonuses, highlighting the continued variation in compensation practices across business aviation.

USA Lead/Manager Benchmark Report

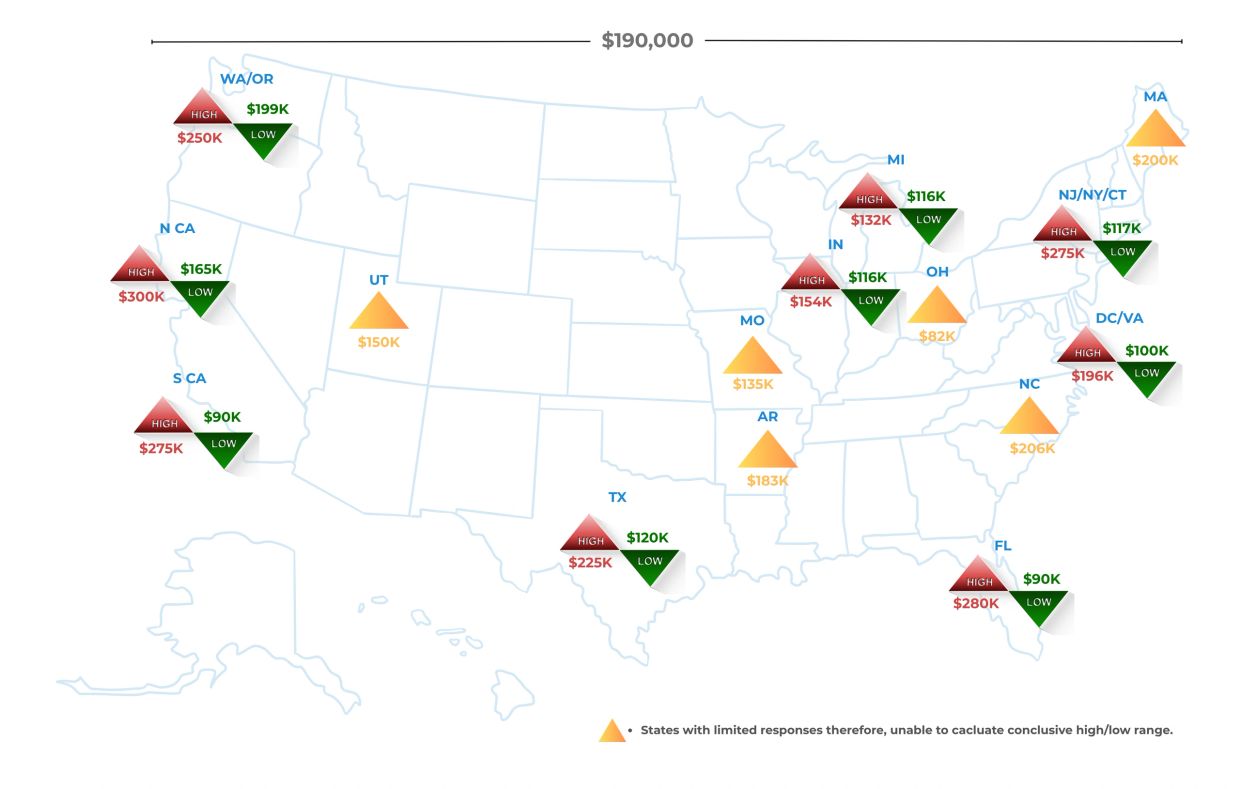
USA Lead/Manager Benchmark Salary

USA Lead/Manager Benchmark Statistics

The 2026 USA Lead Flight Attendant Salary Survey provides one of the most comprehensive snapshots of compensation for Lead Flight Attendants and Cabin Managers working in business aviation today.


The survey identified an annual median salary of approximately $190,000–193,000, establishing $190,000 as the 2026 benchmark salary for experienced Lead Flight Attendants and Cabin Managers in the United States.


Based on survey responses from flight departments across the United States, annual compensation ranged from $82,000 to $300,000, with a median salary of $190,000.


$115,000-$135,000 > Emerging Lead Flight Attendant

$135,000-$175,000 > Developing Leader

$175,000-$200,000 > USA Market Benchmark

$200,000-$225,000 > Senior Cabin Leader

$225,000-$245,000 > Executive Cabin Manager

$244,000+ > Top 10% of Respondents


Salary Range by Years of Experience

03-05 Years > $82,000-$165,000

06-09 Years > $120,000-190,000

10-15 Years > $132,000-$300,000

16-20 Years > $116,000-$225,000

21-15 Years > $135,000-$270,000

26 + Years > $90,000-$225,000


Salary Range by Type of Operation

Part 91 (Individual/Family) > $135,000-$300,000

Part 91 (Corporation) > $116,000-$275,000

Part 91 (Family & Corporation) > $120,000-$185,000

Part 135 > $90,000-$175,000

Part 91 & 135 > $90,000-$210,000


Participant Type of Flight Operation:

45.6% > Part 91 (Individual/Family)

40.4% > Part 91 (Corporation/Organization)

08.8% > Both Part 91 & Part 135

03.5% > Part 135

01.8% > Part 125


Participant Team Size

14.0% > 1 Cabin Crewmember

14.0% > 2 Cabin Crewmembers

16.3% > 3 Cabin Crewmembers

23.3% . 4 Cabin Crewmembers

14.0% > 5 Cabin Crewmembers

04.7% > 6 Cabin Crewmembers

04.7% > 7 Cabin Crewmembers

09.3% > 8 or More Cabin Crewmembers


The data demonstrates a strong demand for experienced cabin leaders who not only deliver exceptional passenger service but also oversee safety, regulatory compliance, operational coordination, vendor management, budgeting, mentoring, and leadership within increasingly sophisticated flight departments.


Rather than identifying a single "standard salary," this report establishes market benchmarks across multiple experience and responsibility levels to assist both employers and aviation professionals with compensation planning.


What the Data Tells Us: Leadership is Driving Compensation

Today's Lead Flight Attendant is much more than a senior crewmember.


Many respondents oversee:

  • Cabin standards
  • SOP development
  • Purchasing
  • Inventory
  • Budget management
  • Scheduling
  • Hiring
  • Training
  • Vendor relations
  • Safety programs
  • Cabin crew leadership


These expanded responsibilities are reflected in compensation.


The role of the Lead Flight Attendant continues to evolve beyond exceptional inflight service. Today's cabin leaders are strategic partners within the flight department, responsible for safety leadership, operational excellence, team development, and the passenger experience. As expectations continue to grow, this survey demonstrates that compensation is increasingly reflecting the complexity, accountability, and professionalism required to lead today's business aviation cabin operations.

USA Lead/Manager Schedules

Benchmark Data

56% of Lead Flight Attendants and Cabin Managers reported operating primarily in an on-demand environment rather than on a fixed rotation schedule.

Scheduling Model

56% > On-Demand / No Fixed Rotation

14% > Monthly Schedule (often still on-demand)

09% > Fixed Rotation Schedule


14% > Hard Days Off / Protected Days

07% Other / Unique Operations


COMMON SCHEDULE TYPES

More than half of respondents described their operation as:

  • On demand
  • Available when principals fly
  • No fixed rotation
  • Dynamic scheduling based on trip demand
  • 24/7 availability


Typical comments included:

  • "On demand."
  • "No rotation - on demand."
  • "When the principal wants to fly, we fly."
  • "On demand by trip."
  • "On demand with days off."


MONTHLY SCHEDULING

Several departments publish schedules in advance while remaining flexible.


Examples include:

  • Monthly schedule
  • Monthly schedule planned 1-2 months in advance
  • Monthly schedule with on-demand adjustments
  • Crew scheduling based on client needs one month ahead

Rotations

A smaller number of respondents reported structured rotations, including:

  • 8 days on / 6 days off
  • 12 days on / 10 days off
  • 2 weeks on / 2 weeks off

Hard Days Off

Many Lead Flight Attendants reported negotiated "hard days" rather than fixed rotations.


Examples included:

  • 3 hard days off per month
  • 4 hard days off per month
  • 5 hard days off
  • 10 hard days off
  • 20 hard days off


This appears to be a common strategy for balancing operational flexibility with personal time.

Summary

ON-DEMAND FLYING REMAINS THE INDUSTRY STANDARD

Approximately 56% of respondents reported operating primarily in an on-demand environment with little or no fixed rotation, reflecting the dynamic nature of business aviation.


PREDICTABILITY IS INCREASING

While on-demand flying remains the norm, an increasing number of flight departments are publishing monthly schedules to improve work-life balance and provide greater schedule visibility.


PROTECTED TIME OFF IS BECOMING MORE COMMON

Rather than traditional rotations, many organizations now provide hard days off, allowing cabin crew to maintain operational flexibility while ensuring protected personal time.


ONE SIZE DOES NOT FIT ALL

Scheduling practices vary significantly based on:

  • Owner travel patterns
  • Corporate flight department requirements
  • Charter operations
  • Sports team schedules
  • International flying
  • Cabin crew staffing levels
  • Number of aircraft supported

USA Lead/Manager COLA, Bonuses & Additional Findings

Benchmark Data

Approximately three out of four Lead Flight Attendants and Cabin Managers reported receiving regular annual salary increases, while one in four indicated they do not receive consistent raises.


Annual Salary Increase Responses:

75.6% > Yes

24.4% > No

Typical Annual Salary Increase

Among respondents who receive annual increases, the most common range was:


02%-03% > Most common

03%-05% > Very common

05%-08% > Less common

10% + > Limited to exceptional performance or promotions


Observations: 

  • 3% annual increases were by far the most frequently reported.
  • Several respondents reported annual cost-of-living adjustments (COLA) in the 2-4% range.
  • Others receive merit-based increases tied to performance rather than automatic annual adjustments.

Annual Bonuses

Approximately 75-80% of respondents reported receiving some form of bonus or incentive compensation.


The majority of respondents receiving bonuses reported  10-15% of annual salary.


Examples included:

  • 7% annual bonus
  • 10% annual bonus
  • 10-15% performance bonus
  • 15% annual incentive
  • $20,000 annual bonus
  • $45,000 annual bonus
  • Two months' salary as a bonus
  • Holiday bonus tied to company performance


Additional Compensations

Beyond salary and bonuses, respondents also reported receiving:

  • Stock options
  • Company-owned stock dividends
  • 401(k) contributions
  • Uniform allowance
  • Merit increases
  • Cost-of-living adjustments (COLA)
  • Holiday bonuses
  • Profit sharing


These benefits significantly increase total compensation beyond base salary.


Anual Raises and Bonuses Key Findings

76% RECEIVE ANNUAL RAISES

Nearly three-quarters of respondents indicated they receive annual salary increases, with 3% emerging as the most common adjustment.


BONUSES ARE COMMON

Approximately 80% reported receiving some form of bonus or incentive compensation.


The most frequently reported bonus range was:

10-15% of annual salary.


TOTAL COMPENSATION CAN BE SUBSTANTIAL

Several respondents noted that bonus programs significantly increased their overall earnings.


Examples included:

  • $45,000 annual bonus, resulting in $270,000 total compensation
  • 10-15% annual bonuses
  • Two months' salary as an annual bonus
  • $20,000 annual bonus
  • Stock options and company equity participation


COMPENSATION EXTENDS BEYOND SALARY

The survey indicates that employers are increasingly using a combination of:

  • Competitive base salaries
  • Annual merit increases
  • Performance incentives
  • Long-term equity programs
  • Retirement contributions


... to attract and retain experienced cabin leaders.

Small Teams Continue to Define Business Aviation

The survey demonstrates that business aviation continues to operate with lean cabin staffing models:


28.0% > 1-2 Cabin Crewmembers

53.5% > 3-5 Cabin Crewmembers

18.5% > 6 or More Cabin Crewmembers


SINGLE PERSON OPERATIONS REMAIN COMMON

Approximately 14% of respondents serve as the only full-time cabin crewmember within their operation. Many of these departments supplement staffing with contract flight attendants during periods of increased flight activity.


LARGER FLIGHT OPERATIONS

Nearly one in five respondents work within cabin teams of six or more crewmembers, typically supporting multi-aircraft operations, larger flight departments, or organizations with dedicated cabin leadership roles.

Report Narrative

Business aviation cabin departments remain relatively small, with more than 80% of respondents working in teams of five or fewer cabin crewmembers.


Four-person cabin teams were the most common organizational structure reported, while more than one-quarter of respondents work in departments with only one or two cabin professionals. 


Several organizations supplement their full-time staffing with contract flight attendants, providing additional flexibility during periods of increased flight activity.

Insights

More than 80% of Lead Flight Attendants and Cabin Managers work within cabin teams of five or fewer crewmembers.


This finding underscores one of the defining characteristics of business aviation: leadership is often exercised in small, highly collaborative teams. 


Lead Flight Attendants frequently balance operational flying responsibilities with scheduling, training, safety oversight, vendor coordination, and team management, making versatility and leadership essential components of the role.

Know Your Worth

Full-Time Salary Negotiation Questions to Ask

To provide the most accurate salary estimate and negotiating power there are several questions you should ask. These answers will support your targeted salary range.  


Questions, such as:

  • Type of operation? i.e. private owner (individual/family or corporation, fractional, charter or shuttle)
  • How much experience do you have?
  • Where is the flight department based?
  • Are you required to live at base or will you position via the airlines?
  • Number of aircraft?
  • Are you going to be the only cabin crewmember or will there be additional crewmembers?
  • What type of schedule and/or rotation is to be expected?
  • Do you have firm days off per month or a set schedule?
  • How many days are you projected to fly per month? 
  • What is the total volume of flight hours expected annually?
  • What is the estimated extent of international travel?
  • If there is a scheduled rotation, how are the crew swaps coordinated domestically and internationally?
  • If international airline travel is required, is there a policy/standard for positioning crew to fly in the main cabin, business or first class?
  • Are there additional duties/responsibilities required when not flying?
  • Will you have a set per diem or reimbursable expenses?
  • What benefits are included? Healthcare, 401K (is there a percentage match?), contract agreement, training and uniform allowances and/or reimbursement, profit sharing, and so on.
  • Do you receive vacation days? An accrual? PTO?
  • Is there cost of living increases annually? If so, what is the percentage?
  • Are there any bonsues or incentive programs?

Additional Salary Considerations

Most full-time base salaries are based on an average of 12–15 flying days per month.


  • If you typically fly 10 days or fewer per month, your base salary may be lower to reflect the reduced flying schedule—but this is not always the case. Other responsibilities and expectations should also be considered.


  • If you fly 10-20 days per month, your salary should generally be based on no fewer than 15 flying days per month, as this represents the industry average for many full-time positions.


  • If you regularly fly more than 20 days per month, your salary should be calculated using 18-22 flying days per month at a minimum, reflecting the significantly higher workload and time commitment.

Additional Factors That Increase Your Negotiating Leverage

Flying days are only one part of the equation. Consider the following when evaluating a compensation package:


  • Exclusivity: Are you permitted to accept contract work on your scheduled days off, or are you required to be exclusively employed by the company regardless of whether you are flying? If exclusivity is required, you have stronger justification for negotiating toward the higher end of the salary range.
  • Schedule and Days Off: Do you have a published rotation or guaranteed days off each month? Are those days protected, or are they routinely changed based on operational needs? If you are effectively expected to remain available at all times, your negotiating leverage increases considerably. Whenever possible, negotiate for guaranteed, protected days off each month to support work-life balance and prevent long-term burnout.
  • Ground Responsibilities: If your role includes ongoing responsibilities when you are not flying—such as aircraft stocking, inventory management, office administration, scheduling, trip planning, training coordination, or other operational duties—those responsibilities should be reflected in your compensation.

Contractor vs Salary Considerations

If you currently work as an independent contractor and regularly fly more than 15 days per month, carefully compare your annual earning potential before accepting a full-time position. While your total annual income may be lower as a salaried employee, a full-time role often provides valuable benefits such as health insurance, retirement contributions, paid time off, training, and greater income stability.


Ultimately, compensation should be evaluated as a total package, not solely on annual salary. In many cases, the long-term value of benefits, job security, and quality of life can outweigh a higher contract income.

Salary Algorithm Calculator

COMING SOON!

Global Benchmark Salary Report

Global Full-Time Cabin Crew Benchmark Salaries
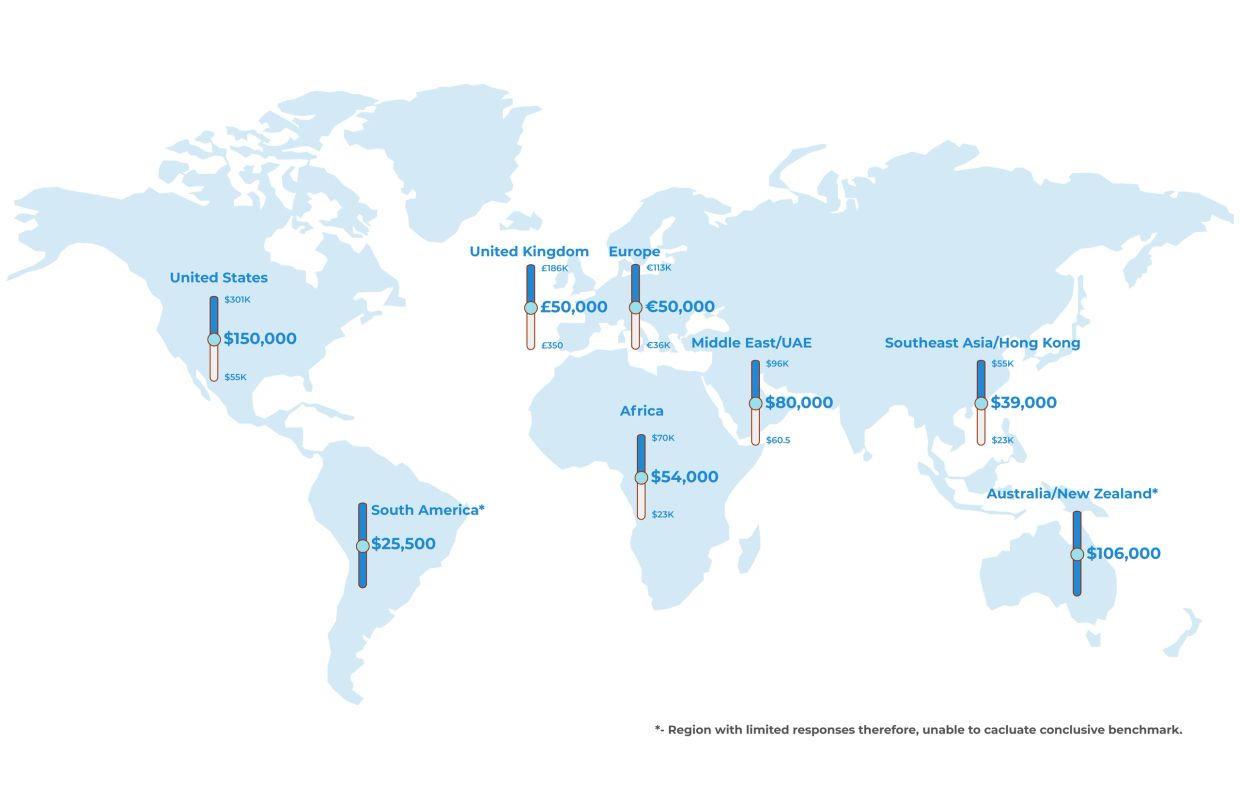
Global Benchmark Overview

The 2026 Global Full-Time Cabin Crew Salary Survey highlights a diverse international business aviation workforce, with respondents representing Europe, the United Kingdom, Africa, the Middle East, Asia, and South America.  (USA statistics are omitted in this report)


Unlike the U.S. market, compensation and employment structures varied considerably by region, operator size, and rotation schedule. While salary ranges differed substantially, several common operational trends emerged.


Key Findings - Geographic Representation

  • Approximately 41% of respondents were based in continental Europe.
  • 15% were based in the United Kingdom.
  • Nearly 9% represented African operators.
  • The remaining respondents represented the Middle East, Asia and multinational/global operations.


Flying Days

The majority of respondents flew relatively moderate schedules.

  • 47% fly 6-10 days per month
  • 26% fly 11-15 days per month
  • 21% fly 16-20 days per month
  • Only a small percentage reported schedules exceeding 20 flying days each month.


This reflects the longer rotational schedules common within international business aviation.


Team Size

Most global operators continue to employ relatively small cabin departments.

Approximately:

  • 35% work within teams of 2 cabin crew
  • 12% work within teams of 3
  • 9% are the sole cabin crewmember


Several respondents represented very large corporate flight departments with dozens—or even hundreds—of cabin crew, illustrating the broad range of global operations.


Fleet Size

Single-aircraft operations remain the most common globally.

Approximately one-third of respondents reported operating a single aircraft, while the remainder represented fleets ranging from two aircraft to multinational operations managing more than 300 aircraft.


Cost of Living & Bonuses

Unlike the U.S. survey, bonus structures varied significantly.

Responses indicate:

  • Many operators provide no formal bonus or cost-of-living adjustment
  • Others offer:
  • annual salary reviews
  • performance bonuses
  • seniority increases
  • holiday bonuses
  • profit sharing
  • housing and travel benefits in lieu of salary increases


There is no clear international standard for annual salary adjustments.


Industry Experience 

The survey indicates that the global full-time cabin crew workforce is highly experienced, with the majority of respondents reporting more than a decade in business aviation.

  • Approximately 9% have 0–5 years of experience.
  • Approximately 21% have 6–10 years of experience.
  • Approximately 41% have 11–20 years of experience.
  • Approximately 29% have more than 20 years of experience.


Key Insight

More than 70% of respondents reported over 10 years of business aviation experience, suggesting that global full-time cabin crew positions continue to be held by seasoned professionals. This level of experience reinforces the specialized nature of international business aviation operations and supports the premium placed on technical knowledge, service expertise, and operational adaptability.


Key Global Observations

The survey suggests several themes:

  • Europe continues to represent the largest concentration of business aviation cabin professionals participating in the survey.
  • Rotational schedules remain the preferred staffing model outside North America.
  • Small cabin departments continue to dominate international operations.
  • Compensation packages are often supplemented through housing, travel benefits, annual bonuses or other allowances rather than salary alone.
  • Considerable variation exists between operators, making regional benchmarking more meaningful than attempting to define a single global salary standard.

Global Lead/Manager Benchmark Salaries
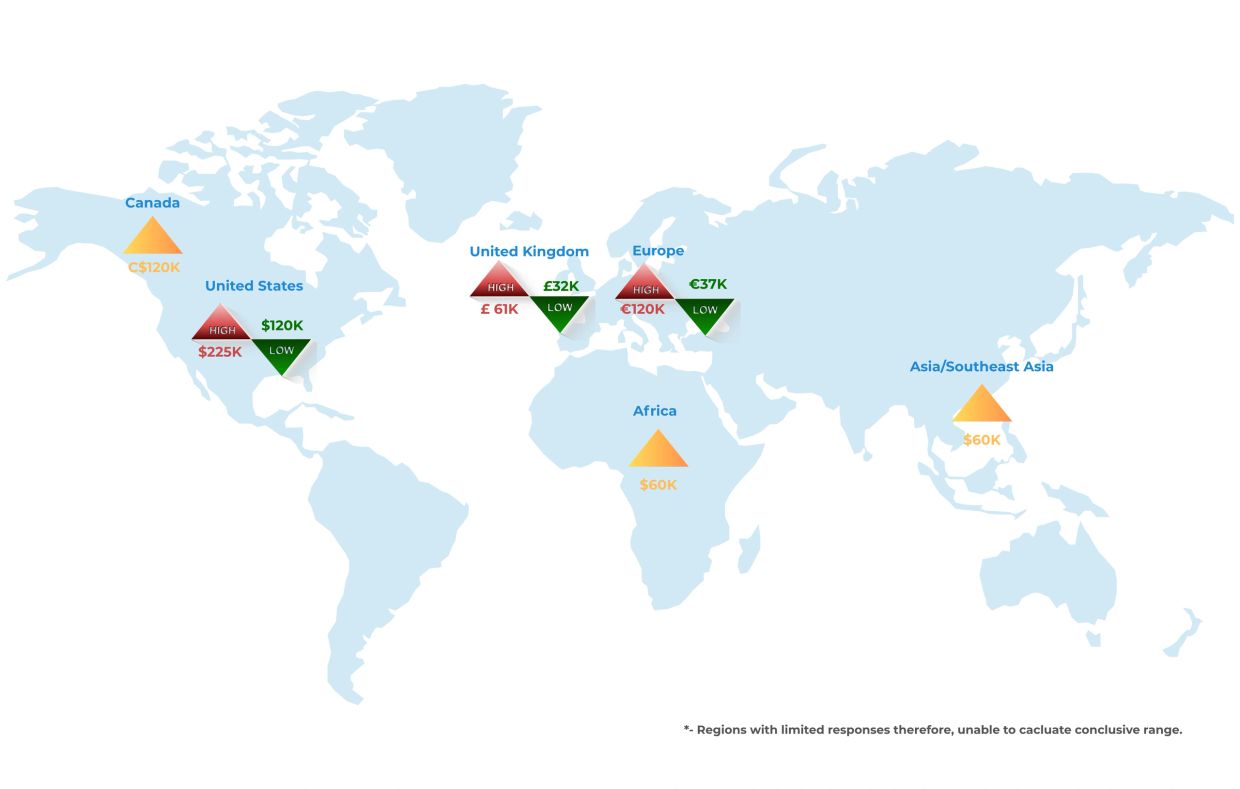
Global Benchmark Overview

Leadership responses demonstrate that Lead Cabin Attendants and Cabin Services Managers often balance flying responsibilities with administrative oversight, including scheduling, standards development, training, recruiting and department management.

Unlike many U.S. leadership roles, several international managers continue to fly regular line schedules while simulataneously managing cabin operations.


Key Findings Geographic Distribution

Leadership respondents represented:

  • Europe
  • United Kingdom
  • Africa
  • Asia

with Europe accounting for approximately one-third of respondents.


Flying Days

Leadership flying schedules remained relatively active.

  • 33% reported flying 11-15 days per month
  • 22% flew 16-20 days
  • 22% flew 6-10 days
  • 22% flew 1-5 days, reflecting more management-focused positions.


Team Size

Leadership responsibilities varied considerably.

Most respondents manage:

  • 2-4 cabin crew

while several oversaw significantly larger departments containing dozens of personnel.


Fleet Oversight

Nearly half managed single-aircraft operations, while others oversaw fleets of multiple aircraft or enterprise-level operations.


Annual Increases & Bonuses

Leadership compensation showed considerable variation.

Some respondents reported:

  • annual salary increases
  • performance bonuses
  • uniform allowances
  • retirement contributions

However, several reported receiving no bonus or annual increase, reinforcing the lack of consistency across global operators.


Industry Experience

Leadership respondents reported extensive experience, reflecting the progression from line cabin crew to management and operational leadership roles.

  • Approximately 11% have 6–10 years of experience.
  • Approximately 33% have 11–20 years of experience.
  • Approximately 56% have more than 20 years of experience.

No leadership respondents reported fewer than six years of industry experience.


Key Insight

Leadership positions are overwhelmingly filled by highly experienced professionals, with nearly 90% reporting more than 10 years in business aviation and more than half exceeding 20 years of experience. This underscores the industry's preference for experienced leaders who can effectively manage operational complexity, regulatory compliance, crew development, and high-level client expectations.


Leadership Trends

The survey suggests that international cabin leaders increasingly perform hybrid roles, combining:

  • Cabin service leadership
  • Flight attendant duties
  • Training
  • Administration
  • Standards management
  • Operational oversight

rather than functioning exclusively as managers.


This trend appears particularly common within small and mid-sized international flight departments.


GLOBAL SUMMARY - FULL-TIME & LEAD/MANAGERS

Both groups are composed primarily of experienced professionals, but leadership roles skew even more heavily toward long-tenured individuals. More than half of Lead/Managers reported over 20 years in business aviation, reflecting the significant experience typically required to oversee cabin operations and personnel.

Copyright © 2013/2026 Sajet Solutions - All Rights Reserved. 

Established: January 2013.

Powered by

  • Scott D. Arnold
  • Dr. Shari
  • Aviation Leadership
  • Assessments
  • Cabin Safety
  • Consulting
  • Client Online
  • Student Online
  • Contact

This website uses cookies.

We use cookies to analyze website traffic and optimize your website experience. By accepting our use of cookies, your data will be aggregated with all other user data.

DeclineAccept